1. Introduction
This Kaggle's StumbleUpon challenge has been around for sometimes by now, but I thought it'd be a great exercise to do them again, and this time we'll do it with the help of Dataiku platform. The idea is pretty much simple, how can we predict if an article getting submitted to StumbleUpon is an "ephemeral" or an "evergreen". And as usual, Kaggle will provide you with both a train and test datasets from their site. Following paragraphs are simply taken from Kaggle's StumbleUpon page.
StumbleUpon is a user-curated web content discovery engine that recommends relevant, high quality pages and media to its users, based on their interests. While some pages we recommend, such as news articles or seasonal recipes, are only relevant for a short period of time, others maintain a timeless quality and can be recommended to users long after they are discovered. In other words, pages can either be classified as "ephemeral" or "evergreen". The ratings we get from our community give us strong signals that a page may no longer be relevant - but what if we could make this distinction ahead of time? A high quality prediction of "ephemeral" or "evergreen" would greatly improve a recommendation system like ours.
Many people know evergreen content when they see it, but can an algorithm make the same determination without human intuition? Your mission is to build a classifier which will evaluate a large set of URLs and label them as either evergreen or ephemeral. Can you out-class(ify) StumbleUpon? As an added incentive to the prize, a strong performance in this competition may lead to a career-launching internship at one of the best places to work in San Francisco.
2. Data Dictionary
There are two components to the data provided for this challenge:
The first component is two files: train.tsv and test.tsv. Each is a tab-delimited text file containing the fields outlined below for 10,566 urls total. Fields for which no data is available are indicated with a question mark.
The first component is two files: train.tsv and test.tsv. Each is a tab-delimited text file containing the fields outlined below for 10,566 urls total. Fields for which no data is available are indicated with a question mark.
train.tsvis the training set and contains 7,395 urls. Binary evergreen labels (either evergreen (1) or non-evergreen (0)) are provided for this set.test.tsvis the test/evaluation set and contains 3,171 urls.
The second component is raw_content.zip, a zip file containing the raw content for each url, as seen by StumbleUpon’s crawler. Each url’s raw content is stored in a tab-delimited text file, named with the urlid as indicated in train.tsv and test.tsv.
The following table includes field descriptions for train.tsv and test.tsv: By default, the initial dataset coming from Kaggle’s challenge page would give you the above dataset features at hand. But we’ll try to optimize them to something much more Machine Learning friendly looking dataset.
3. Data Flow
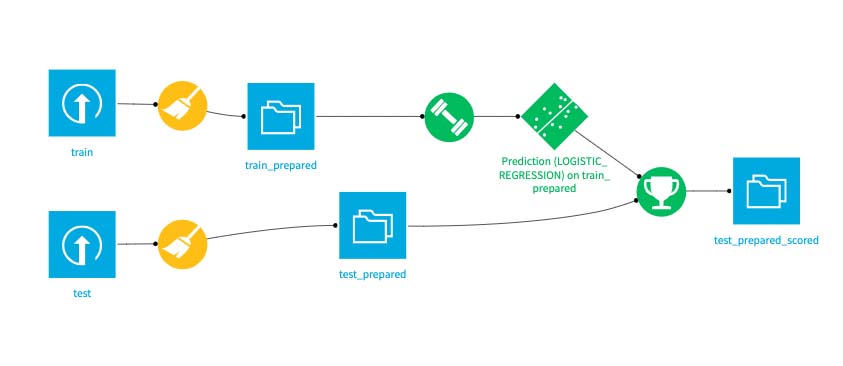
My approach toward this is pretty much straightforward, as a first step, it's required for you to download the whole dataset and have them imported to your working Dataiku project space. I would assume you know your way around to navigate the Dataiku's interface and be able to have the project space and data importing properly registered. And here's how my current data workflow would look like.
3. Cleaning-up The Data
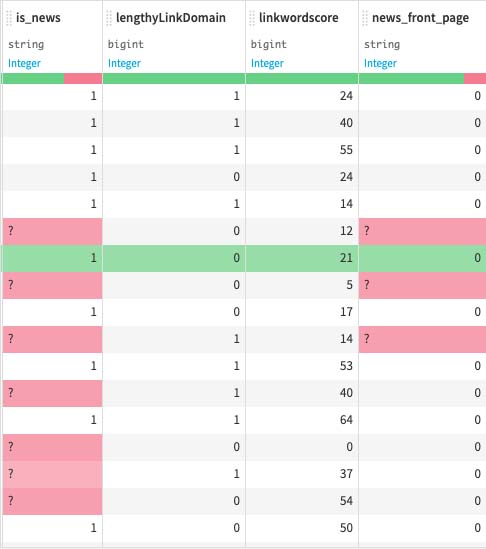
As with many other Machine Learning project out there, you wouldn't get a Model friendly dataset from the whole beginning of finding them. So our first objective would be to clean our dataset and turn them to a more machine learning friendly algorithm. Our current dataset's still requiring us to perform a lot of cleaning, since we can see that we still have unwanted characters much like a question mark, here and there.
4. Data Modeling
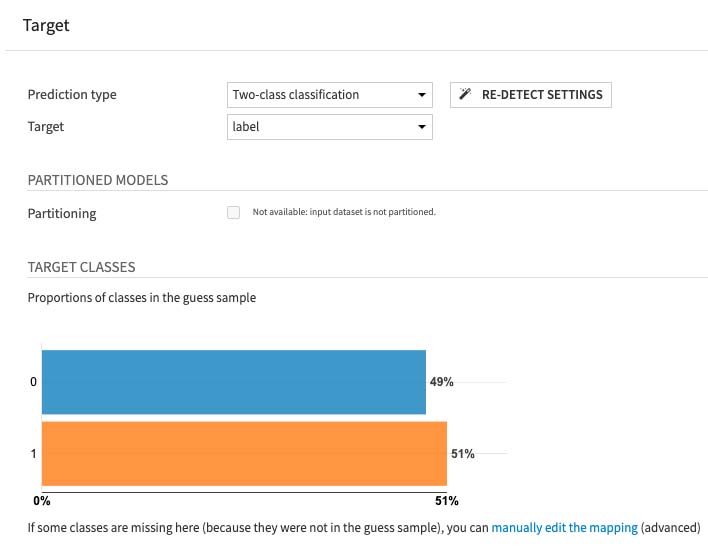
As this article would only be a short and sweet walkthough of the project, I'm not going to dive in further on each and every steps, and rather only focusing on the high level overview of the situation. Next, we go along with the data modeling of the dataset. Since the project is to predict whether or not a single URL submission would be a long lasting one or not, which on this case getting represented with the feature of 'label', it would than imply we're conducting a Two Class Classification machine learning algorithm.
And for the case, Dataiku is shipped with the feature by default. Choose the 'Two Class Classification' from the drop down menu and pick the label as the target that we wish predict, as shown by the pciture below.
5. Running The Modeling
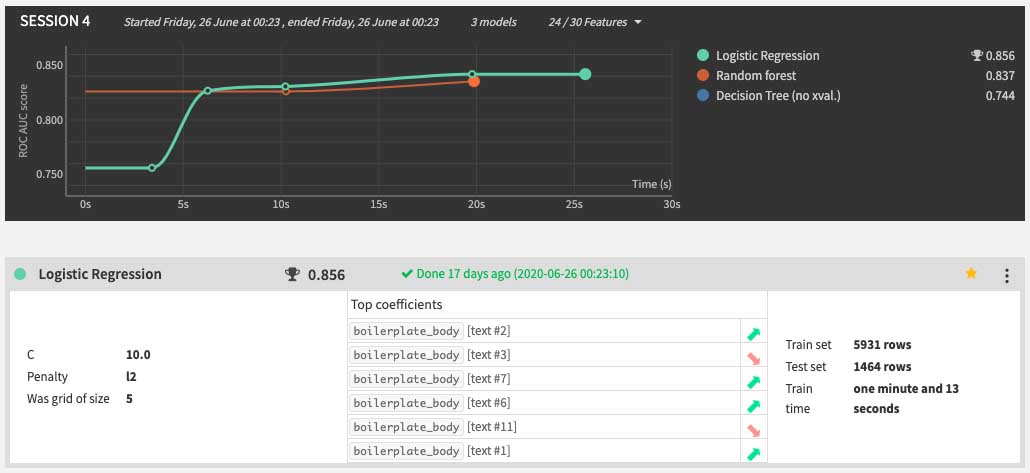
Once that we're satisfied with our previous result, we move into our next step, which involve in testing and running our previously define data modeling. Now this part the result may vary on your end, do to the fact, you might set the sampling method different with mine. I'm running the 'Logisitic Regression' algorithm for this case, which in returned delivered me a sufficient AUC (Area Under The Curve) ROC (Receiver Operating Characteristics) score.
- 0.5 = This suggests no discrimination, so we might as well flip a coin.
- 0.5-0.7 = We consider this poor discrimination, not much better than a coin toss.
- 0.7-0.8 = Acceptable discrimination
- 0.8-0.9= Excellent discrimination
- >0.9 = Outstanding discrimination"
6. Run The Model Againts The Test Dataset
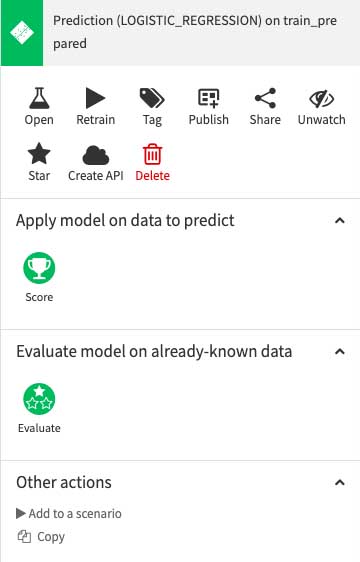
Now that we've settled our model's score, it's time for the actual action of the game, which is testing them againts our test dataset. Simply click on the Machine Learning algorithm icon on the dataflow, click the score icon on the right hand panel and choose the to test them againts the test dataset. It's pretty much by straight forward, so simply just accept the default configuration that Dataiku would offer you.
7. The Result
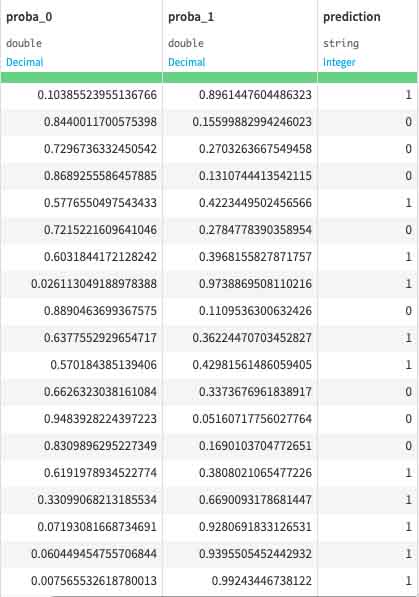
And there you have it, as our modeling and algorithm from previous walked-through scenario tested againts the test dataset, it would by the end of it, yield us the following results. Please scroll to the right and by each row of the test dataset, now is getting added with 3 additional coloumns. First would be the proba_0, proba_1 and prediction. Luckily, this dataset is somewhat relatively easier to work with, and by some minor tweaks it already giving us a decent final score to test our test dataset againts with.
8. Submission to Kaggle
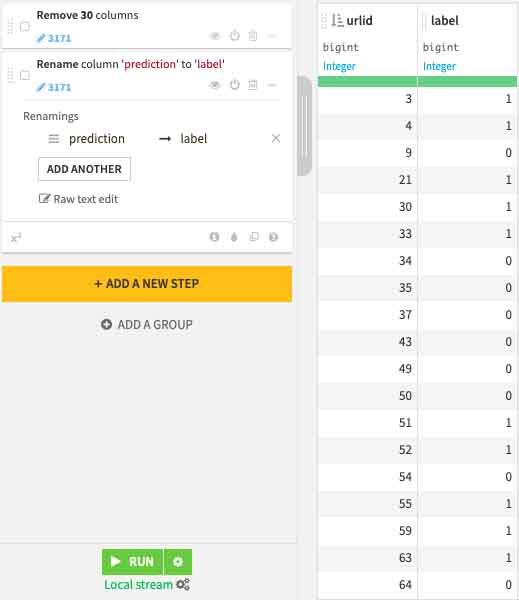
What comes next after those previous preparation of data modeling and testing, comes the actual submission phase. At the Kaggle site, they would provide you with a template of the accepted data submission format. We simply need to follow it, make a local copy of our results by downloading from the data flow diagram, and have them uploaded to Kaggle submission button.
9. Kaggle Score & Leaderboard
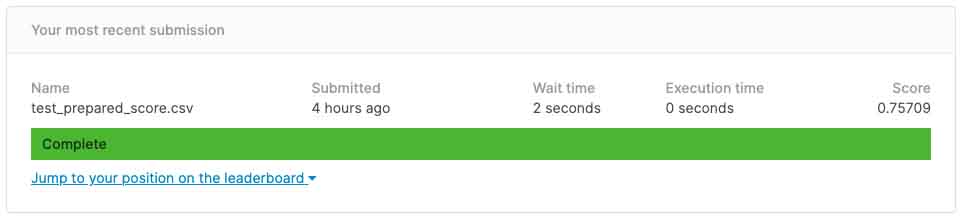
After the submission process you'll get the final score in returned from Kaggle, as with the current submission, we're only getting 0.75, which accoding to my opinion wasn't that so bad. Cause after all, we're only scracthing from the surface, and only from a high level overview. But rest asure you can always tweaks your model and improvise your model again and have them resubmited to Kaggle in ordernto get better final score. But as of now, that should do it as for this current article
10. Jupyter Notebook
Fell free to drop you comments and questions down below, and as always, I also put copies of the project at my GitHub repo, fell free to download them as a single Zip file, and have them restore to your working Dataiku directory. Below are some Dataiku's Jupyter Notebook files I found interesting that we could always take lessons from, thank you for reading this article.
- Correlations analysis on test_prepared_scored (admin).ipynb
- PCA on test_prepared_scored (admin).ipynb
- Predict label in train_prepared.ipynb]
- Statistics and tests on a single population on test_prepared_scored (admin).ipynb